Find your way around the panel
The panel has two layers: the top nav (account-wide pages) and a single server's own page (everything about that one server). This is a map of both, one line per part, with a link to what covers it in full.
The server list
Servers, the first link in the top nav, lists every server on the account as a card — hostname, status, core and version, RAM, plan, region — and clicking one opens its own page. New server starts the create flow; with no servers yet, the same flow is offered from an empty state instead of a grid. A Guided / Classic switch sits above it: Classic is the full form, Guided lays the same choices out as a crafting table with recipes (SMP with friends, Hardcore, Creative build, Modded, Modpack, Network) that fill the slots for you — any slot a recipe fills can still be changed, and both submit the same thing. The choice is remembered in your browser.
A server's page
At the top, one row: the server's name and status, its address — plus a second, Bedrock one once crossplay is enabled, see Connect and share your server — and its controls. Only a running metered server also gets a cost line there, "Live — billing for active GB-hours": a flat server is billed per UTC day it runs, not per GB-hour (see wallet-billing and change-ram-plan), and a free server never draws from the wallet, so neither shows one. Under that row, one line lists the fixed facts — core and version, memory, region, and plan with how it bills — with a link to Settings; the plan itself switches from the top row's ⋯ menu (owner-only).
Below that line is the live panel. Running (and while installing) it renders TPS/MSPT and player counts for cores that report them, plus RAM and CPU with short history graphs when there's a real reading — else an honest "no live metrics yet" in the same spot, the status chip shown either way. A Velocity proxy never gets TPS/MSPT, only RAM/CPU, since it has no world tick to measure, and its RAM tile is the container reading rather than JVM heap. Sleeping, starting, stopping, or failed to start, this area shows that status instead — never a stale reading held over from the last run. While it starts, this area shows which boot step it's on. If you started it from the panel and leave its page open, the panel plays a short chime when it comes up (your browser has to allow sound on the page — it does once you've clicked or tapped anywhere on it, and Start counts) and, if you're in another tab of a desktop browser, retitles this one ● Ready. The Sound on / Sound off button next to the timer turns the chime off, remembered in your browser.
Below the live panel is the section rail: a vertical list on the left, grouped into Operate, Backups & data, and Configure. Every section carries a "?" link straight to its own article.
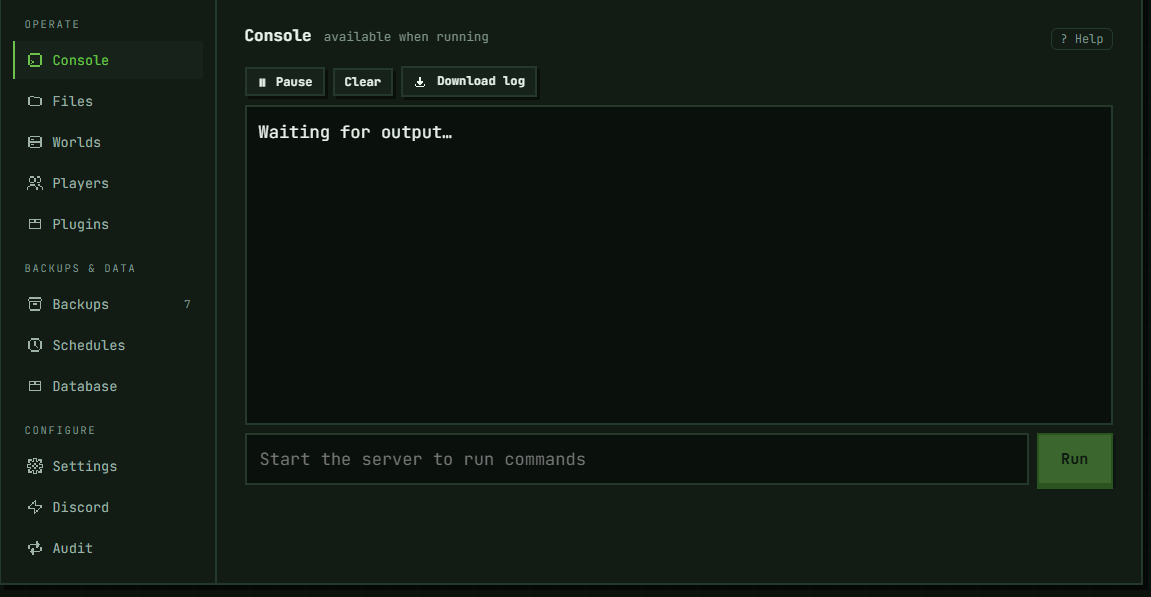
Operate
- Console — live container output plus an RCON command box. → Use the server console
- Files — a browser file manager for the server's data directory. → Manage server files
- Worlds — switch the active world or delete one; bringing in a world archive you already have is a separate flow. → Manage worlds, Import an existing world
- Players — whitelist, ops, bans, and who's online right now. → Manage players, whitelist and ops
- Plugins / Mods — same section, labeled by core (Plugins on Paper/Purpur, Mods everywhere else); not shown at all on Vanilla or while a server is still installing. → Install plugins and mods
Backups & data
- Backups — manual and automatic backups of the server's data directory; download or restore any of them. → Back up and restore your server
- Schedules — cron-scheduled restarts, RCON commands, or backups. → Set up scheduled tasks
- Database — a MySQL-compatible database for plugins that need one, kept outside
/data. → Create a plugin database
Configure
- Network — only on a Velocity proxy server; attaches your other servers to it and routes players between them. A server that's a backend in someone else's network doesn't get this section — it shows a small "In a network" badge near its name instead. → Server networks (Velocity proxy)
- Settings — General, Version & world, Properties, Alerts, Public page, Danger. → Configure server settings. The rest each have their own article: Resources (hidden on the free plan) → Change your server's RAM plan, Wake on join → Wake-on-join and hibernation, Extra ports / Bedrock crossplay (plain Paper or Purpur only, no modpack) / External backend → Connect and share your server, SFTP access → Manage server files.
- Discord — bind a server to a Discord guild for a chat bridge,
/whitelist, and/status; open to any account member, not owner-restricted. → Bind a server to Discord - Audit — a timeline of actions taken on this server, with its own confirmed gaps. → Audit log: who did what
The account pages
These live in the top nav, not on any one server's page — and three of the four are owner-only:
- Wallet — balance, top-ups, auto top-up, spend cap, and the ledger. Owner-only; a Member doesn't see the link. → Wallet: top-ups, auto top-up, spend cap and the ledger
- Members — invite teammates, set roles, revoke access. Also owner-only. → Team members: invites, roles and access
- API keys — long-lived keys for the API and the CLI/MCP tooling built on it. Owner-only, and covered in the developer docs rather than here: docs.truetick.gg
- Profile — account details (email, verification, server count), plus where you actually change things: a password change, or confirming an email change, ends every session on the account; link or unlink Discord, and — under Danger — close the account for good, which opens a pre-filled support request, not an instant delete. The one page here every member can open, not just the owner. No article of its own yet.
In the panel: Dashboard